Equestrian riders use real-time gait apps to access objective stride data so you can spot asymmetry and prevent injuries; use real-time analysis to detect injury risk and track performance gains during training.
The Evolution of Data-Driven Horsemanship
Data streams from training sessions let you track subtle changes in stride, load, and symmetry, giving you actionable insights to prevent injury and refine performance.
Moving Beyond Subjective Visual Assessment
You can stop relying on guesswork by using objective gait metrics that reveal asymmetries invisible to the eye; this reduces risk of undiagnosed injuries and improves training precision.
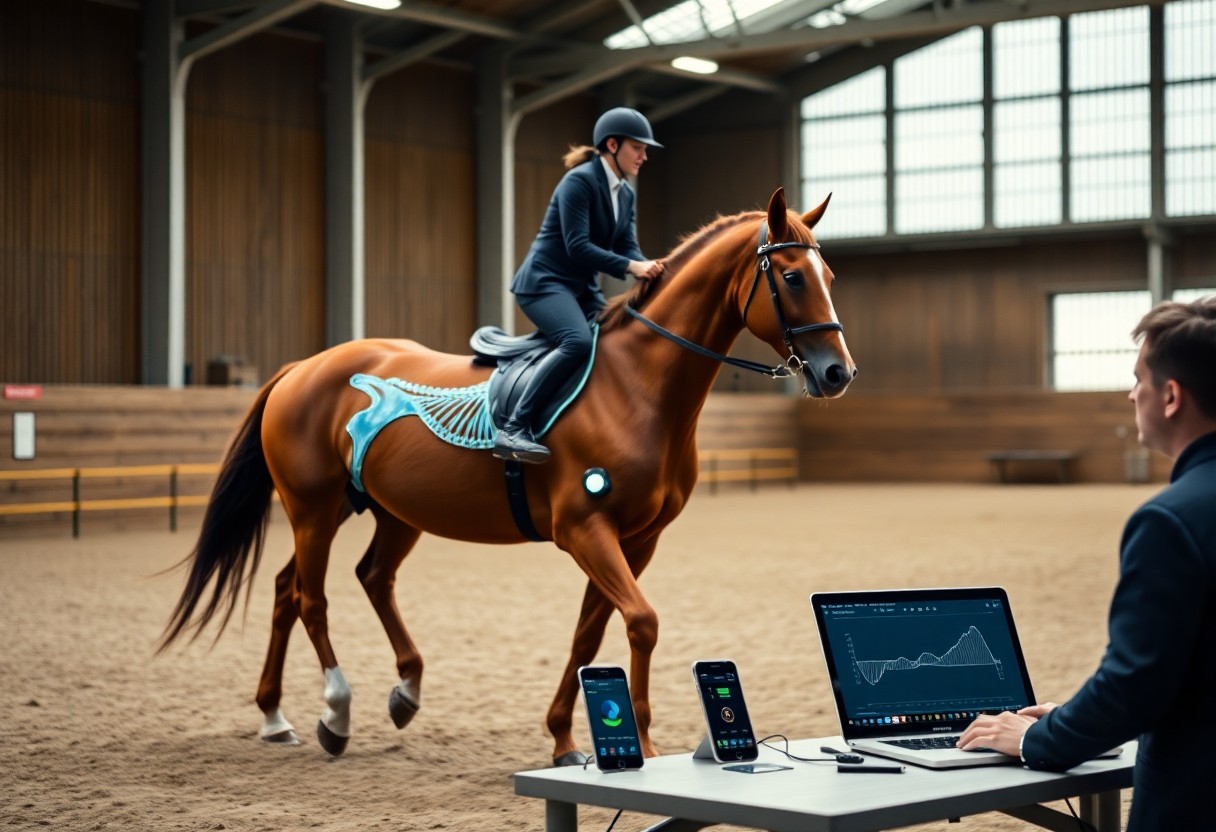
The Role of Wearable Sensors and AI in Equine Sports
Wearable devices and AI algorithms process accelerometer and gyroscope data in real time, delivering immediate alerts on irregularities so you can adjust sessions before problems escalate.
Sensors such as IMUs attached to the girth, limb, or saddle capture stride timing, limb angles, and acceleration at high sampling rates, and you should compare outputs against motion-capture validation studies to confirm accuracy. Machine learning models then classify gait patterns and flag asymmetries; early detection can reduce rehabilitation time and lower injury risk. Placement, calibration, and algorithm thresholds matter: misplacement or noisy data can produce false positives that lead you to unnecessary interventions, so you must monitor device health and review raw traces before changing training plans.
Equisense: Mastering Symmetry and Locomotion
Equisense gives you precise gait analysis so you can detect asymmetry early and track progress. Use its real-time symmetry scores to adjust training and spot potential lameness before it worsens.
Sensor Placement and Real-Time Motion Capture
Sensors sit on the girth or saddle pad so you capture clean stride data; you must avoid loose placement. Proper mounting gives accurate real-time motion capture, while poor placement can produce misleading asymmetry alerts.
Interpreting Cadence, Push, and Balance Metrics
Cadence shows footfall rhythm, push measures hind-end propulsion, and balance reflects weight distribution; you should prioritize consistent cadence and even balance while treating sudden push drops as potential injury signals.
Analyzing stride-to-stride variability helps you distinguish fatigue from training effect; watch for rising asymmetry or declining push, and use trend graphs to set exercise modifications or consult your vet when metrics persist off-target.
Alogo Move: Precision Analytics for Performance Athletes
Alogo Move gives you millisecond-level gait metrics so you can spot asymmetries and inefficiencies during workouts; real-time alerts guide immediate adjustments to protect soundness and sharpen performance.
High-Frequency Data Tracking for Stride Optimization
Sensors sample at high rates so you can refine stride length, contact time, and symmetry on the fly; high-frequency feedback reduces injury risk by flagging abnormal patterns immediately.
Monitoring Longitudinal Progress and Training Intensity
Trends let you track conditioning and workload over weeks, identifying when intensity spikes demand rest; consistent monitoring helps prevent overtraining while boosting targeted gains.
Using Alogo Move’s trend dashboards you can compare week-to-week gait metrics, correlate workload spikes with fatigue markers, and schedule recovery before lameness appears. You can set individualized thresholds so the app flags deviations beyond your horse’s normal range; early detection reduces long-term injury risk and sustains peak performance.
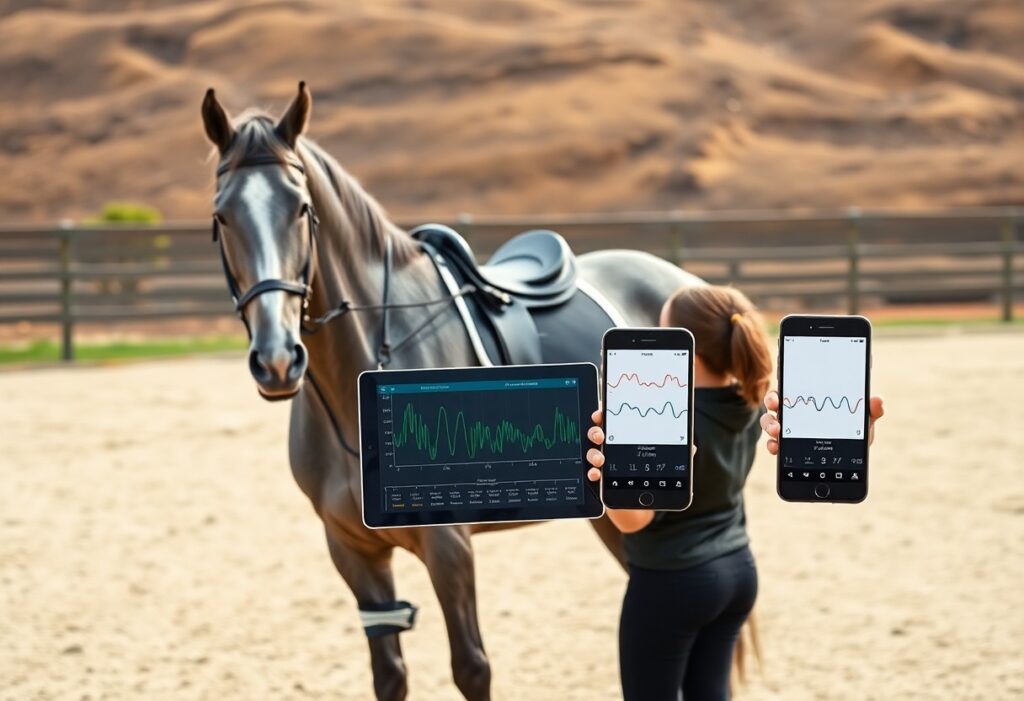
Equilab: Using AI for Accessible Gait Analysis
Equilab analyzes your horse’s stride via phone sensors and AI, delivering real-time gait metrics, asymmetry alerts, and ride summaries that help you spot early problems before they escalate.
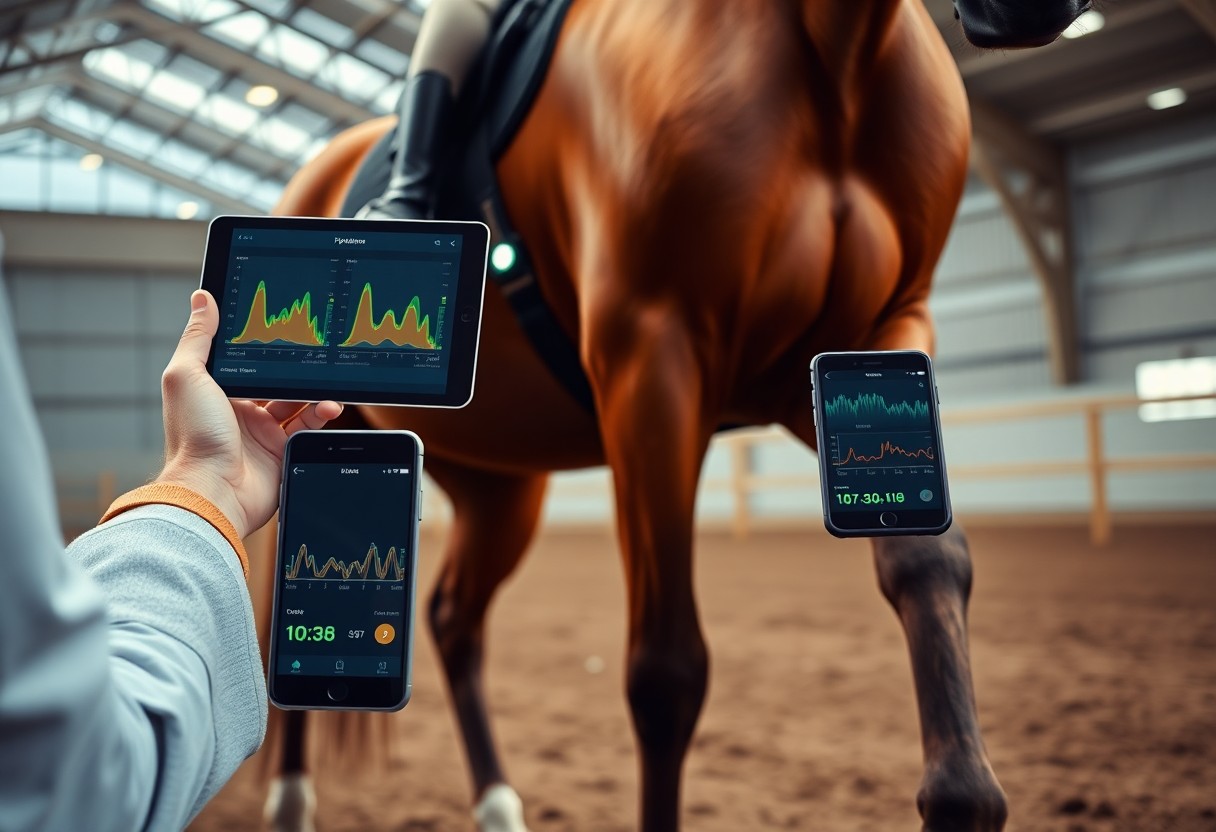
Smartphone Integration and Real-Time Feedback Loops
Smartphone pairing streams sensor data live so you get immediate stride charts, audio cues, and on-ride visuals; instant feedback lets you correct asymmetry within the same session.
Identifying Subtle Irregularities and Gait Deviations
Algorithms spot tiny deviations in stride length and timing that you might miss, flagging trends and producing alerts for early lameness indicators or gait deterioration.
You should review session graphs, compare baseline measurements, and watch for repeated spikes or side-to-side asymmetry; persistent or worsening patterns require a vet exam since sensors can miss rider-induced artifacts, while consistent deviations over multiple rides are strong evidence of a developing problem.
Technical Indicators of Soundness and Efficiency
Sensors translate motion into metrics so you can spot asymmetry and inefficient stride patterns early, measuring stride length, limb load and impact. Use this data to adjust training loads and address hidden lameness before it worsens.
Understanding Elevation and Regularity Benchmarks
Benchmarks show expected elevation and timing ranges for each gait; you should compare your horse’s data to detect irregularity or reduced suspension, indicating fatigue or early injury.
Utilizing Heatmaps to Prevent Overuse Injuries
Heatmaps reveal concentrated limb impact over time so you can spot hotspots where repeated stress raises overuse injury risk, letting you modify work patterns or shoeing.
Detailed heatmap layers let you filter by speed, surface and session type so you can identify persistent high-load zones on the same limb; then alter footing, adjust interval sets, or consult your vet to prevent a small overload becoming a career-limiting injury.
Integrating Biometric Insights into Training Regimes
Applying biometric feedback in sessions lets you tailor intensity, catch early asymmetry, and cut injury risk, producing measurable gains in consistency and fitness.
Establishing Baselines for Individual Horse Profiles
Create a baseline from multiple rides across gaits and surfaces so you can spot deviations; compare against your horse’s normal range to flag abnormal asymmetry.
Collaborative Data Sharing with Veterinarians and Farriers
Share gait exports with your vet and farrier so you get faster diagnoses and targeted shoeing; timely alerts can shorten recovery.
Connecting your app’s session timeline to your veterinarian’s portal lets you annotate lameness episodes, attach synchronized video, and show quantitative change after treatments. Providing raw sensor files and trend graphs helps farriers match trimming to measured stride deviations, reducing guesswork and lowering reinjury risk.
To wrap up
With this in mind, you can select an app that provides real-time gait metrics, interpret stride and symmetry data confidently, and use objective feedback to refine your riding and care plans while monitoring progress over time.
FAQ
Q: What do these gait-analysis apps do and how do they work?
A: Three common approaches power current apps: smartphone video with AI pose estimation, wearable inertial measurement units (IMUs), and marker- or camera-based motion-capture systems with pressure sensors. EquiGait (smartphone) analyzes live video to estimate stride length, cadence, limb angles and symmetry, and overlays feedback on the display so a rider or handler can adjust in-session. StrideSense (wearable) uses IMUs attached to the poll and hooves or pasterns to deliver millisecond timing, vertical acceleration and angular velocity metrics that feed an algorithm producing lameness scores and asymmetry graphs. HoofTrack Pro (camera/pressure) integrates high-speed cameras with hoof pressure mapping to produce ground-reaction force estimates and three-dimensional motion traces for detailed biomechanical review. Common real-time features include automatic gait segmentation, symmetry/asymmetry plots, threshold alerts, repeatable test protocols, cloud session storage, and video export for veterinary or coaching review.
Q: How accurate and reliable are these apps for detecting lameness and measuring gait metrics?
A: Measured accuracy depends on sensor type, sampling rate and testing environment. Controlled studies show IMU systems can measure stride timing and inter-limb timing differences with errors commonly in the 2-7% range, while video-only solutions typically range 5-12% depending on frame rate, occlusion and marker visibility. Clinical lameness-detection sensitivity and specificity vary by product and lameness severity; high-end IMU or force-estimate systems report sensitivities around 85-95% for moderate lameness in blinded trials, while consumer smartphone apps often fall in the 70-85% band. Sources of error include inconsistent sensor placement, uneven footing, tight turns, single-trial snapshots, low lighting and interference from tack, so follow manufacturer mounting and calibration steps and record multiple straight-line trials at a consistent speed. Use these tools as objective screening and training aids, and corroborate abnormal findings with a veterinary exam or force-plate data before making clinical decisions.
Q: What should trainers and owners consider when choosing and using one of these apps?
A: Primary considerations include intended use (training feedback versus clinical assessment), hardware needs, data privacy, cost structure and integration with your workflow. If you need portable, low-cost feedback choose a smartphone-based app; if you require clinical precision favor IMU systems validated in peer-reviewed studies; if you want force or hoof-loading maps select systems that include pressure sensors or lab-grade cameras. Check device compatibility, battery life of external sensors, waterproofing for field use and consistent mounting options for repeatability. Review the app’s data policy to know where session data is stored, retention period and export/delete capabilities, and confirm consent procedures before sharing identifiable data with vets or clients. Trial subscriptions and baseline recordings help establish normal ranges for each horse so you can track progress reliably over time.